Jupiter’s volcanic moon Io is burning much hotter than expected
A new look at Juno shows that Io’s volcanoes emit far more heat than earlier estimates and that long-standing trends need a rethink.

 Edited By: Joshua Shavit
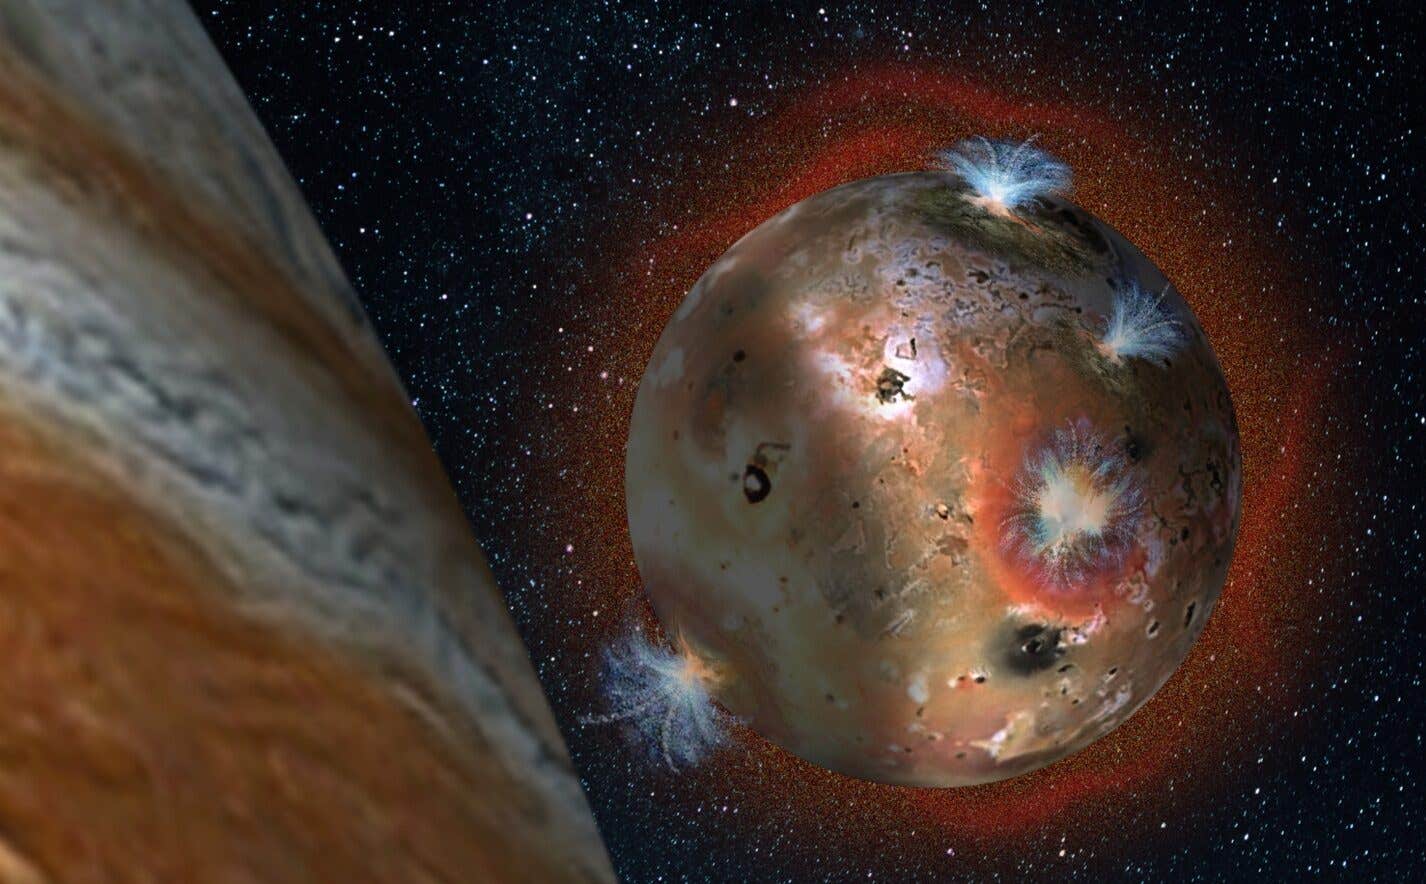
New infrared analysis shows Io releases far more heat than past studies found. (CREDIT: SwRI)
Jupiter’s volcanic moon has always felt like a place that tests your sense of what a world can be. Its surface glows with hundreds of active hot spots. Its mountains rise higher than Everest. Its lava lakes pulse and fracture as if the ground is alive. For decades, scientists have tried to read that turmoil as a clue to the heat churning inside. A new study argues that much of what you have been told about Io’s heat flow needs a careful second look.
The reassessment focuses on data from JIRAM, the infrared mapper aboard NASA’s Juno spacecraft. That instrument watches the moon shine at specific wavelengths that reveal volcanic activity.
The work, led by Federico Tosi of Italy’s National Institute for Astrophysics, shows that some widely used measurements can distort the true scale of Io’s heating. According to the study, the moon’s surface may release hundreds of times more energy than earlier estimates. The problem is not a lack of data. It is how one narrow slice of the infrared spectrum has been used to stand in for the whole.
The Limits of a Single Infrared Band
Many analyses of Io rely on a region of light near 4.8 micrometers called the M band. This part of the spectrum is incredibly useful for spotting the hottest lava. It highlights areas that glow like fresh coals. But it struggles with anything cooler, even if those cooler surfaces cover far more area.
Tosi compares the approach to judging the size of a bonfire by staring at the flames while ignoring the thick bed of embers. The brightest parts of a volcano capture your attention, but most of the heat escapes from broader, cooler crusts that fade from view in the M band. When the team reexamined how that band responds to different temperatures, they found that the same M-band brightness can represent very different total power levels. Without a temperature measurement, the band alone cannot give you a safe estimate of total heat.
JIRAM does have the ability to record those temperatures using its spectrometer, which collects light across a broader range. The problem is that researchers often rely on the M-band images alone because they are easier to work with and available more often. The new study shows why that shortcut introduces major bias.
Lava Lakes That Hide Their Power
Io’s volcanoes are not smooth bowls of molten rock. Juno’s close views reveal something more complex. Most of Io’s largest calderas appear to be lava lakes ringed by very hot rims that surround cooler, solidified crusts. That crust is still warm enough to glow in the infrared. It simply radiates most of its energy at longer wavelengths.
At Chors Patera, for example, the M-band image suggests a power output of about one gigawatt, most of it from the thin ring. When the team estimated the total heat from the interior crust, the number exploded upward. After they factored in the temperature and area of that crust, the total climbed to about 420 gigawatts. The implied ratio of total heat to M-band heat was about 420, far above the small correction factors many studies assume.
A similar pattern appears at other sites such as Catha Patera and Pfu1063. Their M-band powers land between 0.12 and 0.71 gigawatts. Their true thermal outputs range between 100 and 414 gigawatts. In each case, the crust drives the total, not the ring. These are not fringe cases. They represent a broader truth. Cooler terrain still contributes tremendous amounts of heat. It just does not shine brightly in the 4.8 micrometer band.
When researchers treat M-band output as a clean stand-in for total heat, they undercount the cooling crust and end up misreading how much energy Io sends into space.
A Technical Trap: Saturation
Another issue hides in the instrument’s electronics. The M-band camera can saturate when it views something very bright. Past papers do try to avoid pixels that reach saturation, but the new analysis shows that the camera leaves its linear range earlier than many thresholds assume. That means some images have already started bending the true signal downward by the time a pixel looks “safe” on paper.
The spectrometer does not suffer from the same problem and can be used as a reference. When the team compared the two channels, they found clear evidence of clipped brightness in some of Io’s most intense hot spots.
Because the brightest volcanoes supply much of Io’s total thermal output, even small distortions can shift the global picture. In these cases, the study urges future researchers to treat M-band brightness as a lower limit, not a full measurement.
Latitude Patterns That Fade On Closer Inspection
Earlier studies suggested that Io gives off more heat at low latitudes than near the poles. That idea fed debates about where inside the moon tidal heating occurs. Shallow heating should favor the equator, while deep heating should push more energy toward the poles. Some researchers even pointed to slight north-south differences as evidence for deeper processes.
The new paper takes those claims apart. The team sorted the M-band radiance by latitude and subjected it to a wide range of statistical tests. Once they varied the size of the latitude bins and the boundaries between “polar” and “equatorial” regions, the trends fell apart. A small shift in the thresholds could wash out the signal or even reverse it.
The reason is simple. About half of the entire M-band output comes from only 17 of the 266 known volcanoes. With so much energy tied to a tiny group, any attempt to draw smooth north-south patterns becomes unstable. Where those 17 volcanoes happen to fall matters far more than any global trend.
What It Means for the Magma Ocean Debate
Io’s interior may host a global magma ocean, a possibility that has sparked one of the most intense debates in planetary science. Tosi’s team did not try to prove or disprove that idea. Instead, they show that existing M-band trends cannot support firm conclusions about interior structure. Even independent radio science data from Juno point away from a global ocean, but the authors argue that the infrared evidence alone cannot settle the issue.
The takeaway is caution. Any interpretation that rests fully on the M band should be treated as provisional until broader spectral data are used.
Practical Implications of the Research
This study offers a fresh way to understand volcanic activity on Io and other worlds. It shows that single-band measurements can hide major parts of a planet’s energy budget.
Future missions such as Europa Clipper and Juice will see Io from a distance, so the method developed here can help scientists make better use of limited data. These results may also guide the design of future instruments that can handle both bright and faint signals without distortion.
In the long run, improving heat flow estimates can help researchers understand how worlds with active interiors evolve and how tidal heating shapes planets in other solar systems.
Research findings are available online in the journal Frontiers in Astronomy and Space Sciences.
Related Stories
- NASA’s Juno mission solves Io's 44-year-old volcano mystery
- How old is Jupiter? Tiny molten spheres embedded in meteorites have the answer
- Jupiter was once double its current size, study finds
Like these kind of feel good stories? Get The Brighter Side of News' newsletter.
Joseph Shavit
Writer, Editor-At-Large and Publisher
Joseph Shavit, based in Los Angeles, is a seasoned science journalist, editor and co-founder of The Brighter Side of News, where he transforms complex discoveries into clear, engaging stories for general readers. With vast experience at major media groups like Times Mirror and Tribune, he writes with both authority and curiosity. His writing focuses on space science, planetary science, quantum mechanics, geology. Known for linking breakthroughs to real-world markets, he highlights how research transitions into products and industries that shape daily life.