Scientists reveal why gravity is weaker beneath Antarctica than elsewhere on Earth
Antarctica sits over Earth’s weakest gravity zone. A new model rewinds 70 million years to show how it formed.

 Edited By: Joshua Shavit
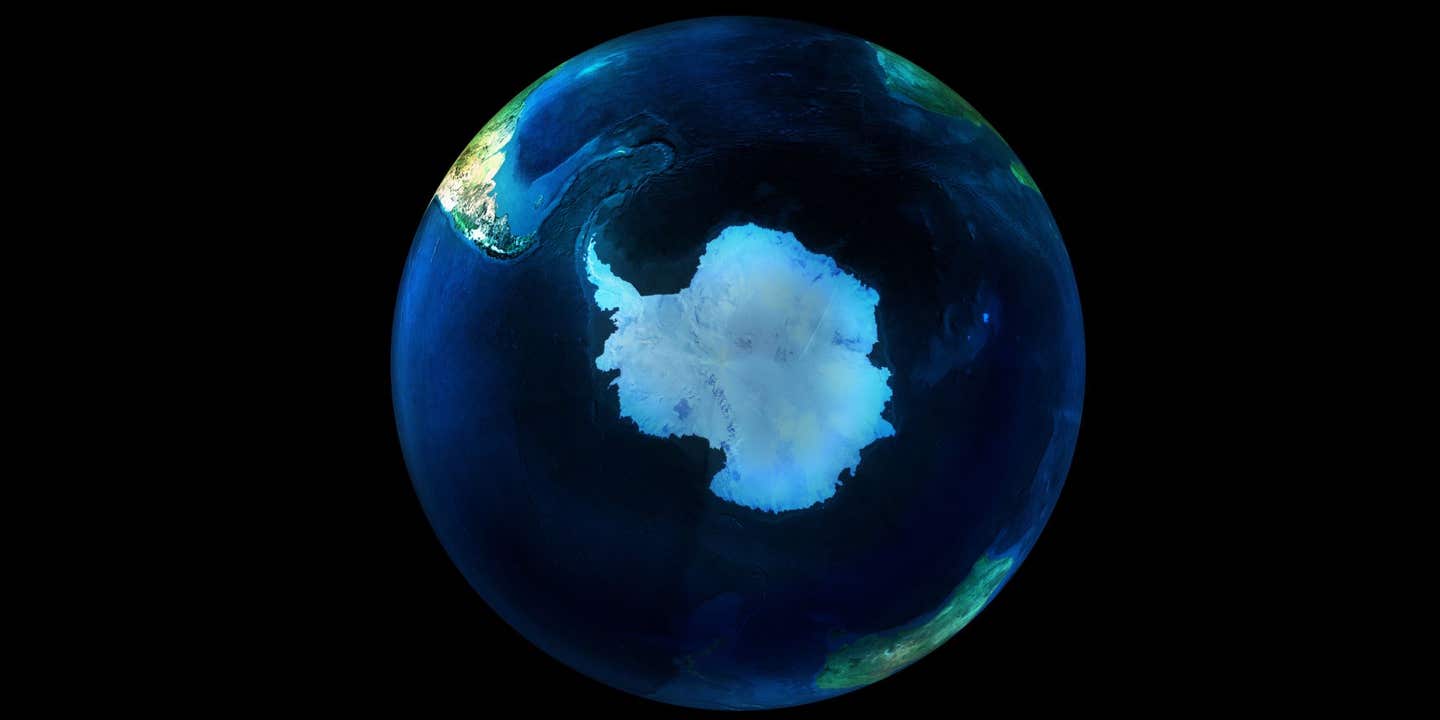
A study traces Antarctica’s gravity hollow to slow mantle motion, with timing that overlaps major shifts in Antarctic glaciation. (CREDIT: Wikimedia / CC BY-SA 4.0)
Gravity feels steady. You drop a set of keys, and they fall the same way every time. That reliability makes it tempting to picture Earth’s pull as uniform.
It is not.
After accounting for Earth’s rotation, gravity is slightly weaker beneath Antarctica than anywhere else on the planet. That weakness creates a kind of “gravity hole,” a broad low in the field that helps shape the sea surface around the southern continent.
A study published recently in Scientific Reports argues that this oddity did not appear overnight. Instead, it reflects extremely slow shifts of rock deep inside Earth, unfolding over tens of millions of years. The authors also point out a striking overlap in timing: the study’s major changes in the Antarctic gravity low line up with major changes in Antarctica’s climate system, including the onset of widespread glaciation.
A low spot that tugs on the ocean
Gravity differences caused by varying rock densities far below the surface are tiny in absolute terms. Yet in the ocean, small differences can matter. Water moves toward slightly stronger gravity. Where gravity is weaker, the ocean surface can sit a bit lower relative to Earth’s center.
Because Antarctica sits over this low, the sea-surface height around the continent is measurably lower than it would otherwise be, according to the source material provided.
“If we can better understand how Earth’s interior shapes gravity and sea levels, we gain insight into factors that may matter for the growth and stability of large ice sheets,” said Alessandro Forte, Ph.D., a professor of geophysics at the University of Florida and a co-author of the study.
The work also tries to clear up a long-running source of confusion. The paper notes “a discrepancy in the definition of geoid anomalies between the space geodetic and geodynamics communities,” which has muddled discussions of the low’s size, geometry, and origins.
Which “geoid” you mean changes the story
In the source material, the authors draw a careful distinction between two ways of describing Earth’s gravity-related shape. One common geodetic representation references a standard ellipsoid, the WGS84 ellipsoid. In that view, the strongest geoid low appears in the Indian Ocean.
Geodynamicists often use a different reference. They subtract a “hydrostatic” ellipsoid that represents the flattening expected from Earth’s daily rotation, without internal dynamics. After that subtraction, the resulting “nonhydrostatic” geoid places the strongest low over Antarctica, not the Indian Ocean.
In this nonhydrostatic picture, the deepest depression sits over the Ross Sea, within the Ross Embayment, between Victoria Land and Marie Byrd Land, according to the source material.
That framing matters because the nonhydrostatic gravitational field is used as a constraint on mantle density anomalies and how they evolve. The paper also describes a broad correlation that has drawn attention for decades: long-wavelength geoid highs align with deep-mantle low-velocity anomalies, while geoid lows line up with higher-velocity zones.
A CT scan made from earthquakes
Forte and Petar Glišović, Ph.D., of the Paris Institute of Earth Physics built their reconstruction using global earthquake recordings and physics-based modeling to infer Earth’s three-dimensional internal structure.
“Imagine doing a CT scan of the whole Earth, but we don’t have X-rays like we do in a medical office. We have earthquakes. Earthquake waves provide the ‘light’ that illuminates the interior of the planet,” Forte said.
From those interior estimates, the team predicted a global gravity pattern. The reconstructed map closely matched satellite gravity data described in the source material as the “gold-standard,” which the authors treat as support for the realism of the underlying models.
Then the study moved beyond a single snapshot. The authors argue that most previous geodynamic modeling has focused on matching the present-day geoid. Their goal was different: to reconstruct the long-term evolution of the geoid over the past 70 million years and explain the time-dependent origin of the Antarctic geoid low.
To do that, they used time-reversed convection modeling. In the source, this is described through a back-and-forth nudging technique and a quasi-reversibility method for reconstructing mantle convection. The approach also links surface plate-like motions with mantle flow, using plate geometries reconstructed from seafloor age and paleomagnetic data.
Rewinding 70 million years beneath Antarctica
When the team tracked the low back through time, the study reports two broad phases at the present-day Antarctic geoid low location. From 70 million years ago to about 35 million years ago, the amplitude fluctuated. From about 35 million years ago to the present, it increased by about 30%, according to the source material.
The source also describes a rapid geographic shift of the maximum global geoid depression. Early in the Cenozoic, the maximum depression was centered over the South Atlantic, between roughly 30°S and 45°S. Between about 40 and 30 million years ago, it shifted to the Ross Embayment, accompanied by a substantial increase in amplitude.
The study’s sensitivity tests, described in the source, suggest that the time window from about 50 to 30 million years ago marks a “robust transition” in the evolution of the Antarctic geoid low across different model configurations, even when the precise amplitude histories vary.
The paper also reports a small reduction in the low’s amplitude over the last 5 million years in almost all modeled cases, based on the source material.
Deep mantle, shallow mantle, and a long-lived upwelling
A central claim in the source is that the low persists because of how different mantle layers contribute over time. Density anomalies in the lower 1000 kilometers of the mantle provide a stable contribution of roughly 30% to 50% of the total amplitude across long spans, according to the source material.
Meanwhile, the contribution from shallower layers changes more. The source describes a shift over the last 35 million years: the contribution from depths shallower than about 1300 kilometers grows, while a mid-mantle contribution declines. That swap helps drive the strengthening since about 35 million years ago.
The study also highlights an “active, anomalously hot, buoyant mantle upwelling” centered below the Ross Embayment as key to understanding the low’s evolution, based on the source material. As that low-density material rises beneath the region, the source notes that it contributes to amplifying the negative geoid low at the surface.
To test whether the time history they reconstruct is plausible, the authors compare predicted changes in the degree-2 component of the geoid against True Polar Wander trajectories estimated from paleomagnetic data. The source describes a pronounced shift in paleomagnetic-based trajectories around 50 million years ago, matched by the model predictions, and treats that agreement as an independent validation of the reconstructions.
Going forward, Forte hopes to test whether the gravity evolution and Antarctica’s ice sheets are linked in a causal way, using modeling that ties together gravity, sea level, and continental elevation changes.
The goal, as Forte puts it, is to answer a big question: “How does our climate connect to what’s going on inside our planet?” he said.
Research findings are available online in the journal Scientific Reports.
The original story "Scientists reveal why gravity is weaker beneath Antarctica than elsewhere on Earth" is published in The Brighter Side of News.
Related Stories
- Scientists solve the 75-year-old mystery of massive 'gravity hole' in the Indian Ocean
- If a tiny black hole passed through your body would it hurt you?
- New map shows Antarctica’s buried landscape in unprecedented detail
Like these kind of feel good stories? Get The Brighter Side of News' newsletter.
Joseph Shavit
Writer, Editor-At-Large and Publisher
Joseph Shavit, based in Los Angeles, is a seasoned science journalist, editor and co-founder of The Brighter Side of News, where he transforms complex discoveries into clear, engaging stories for general readers. With vast experience at major media groups like Times Mirror and Tribune, he writes with both authority and curiosity. His writing focuses on space science, planetary science, quantum mechanics, geology. Known for linking breakthroughs to real-world markets, he highlights how research transitions into products and industries that shape daily life.