What you need to know about #ShowYourStripes Day
The “Show Your Stripes” campaign is a worldwide effort by climatologists, scientists, and more to raise awareness about climate change
[June 21, 2021: Josh Shavit]
No we’re not talking about your favorite striped shirt. The “Show Your Stripes” campaign is a worldwide effort by climatologists, environmental scientists, meteorologists, and many more to raise awareness about climate change. This is a yearly event focused on talking about climate change, its impacts, and how we as a community and a society can work together for a greener future.
The day first gained traction in 2019 after Professor Ed Hawkins of the University of Reading first published a website with the now internationally recognizable climate stripes graphics. Since then June 21 has been #ShowYourStripes day, 2021 marks the third annual event.
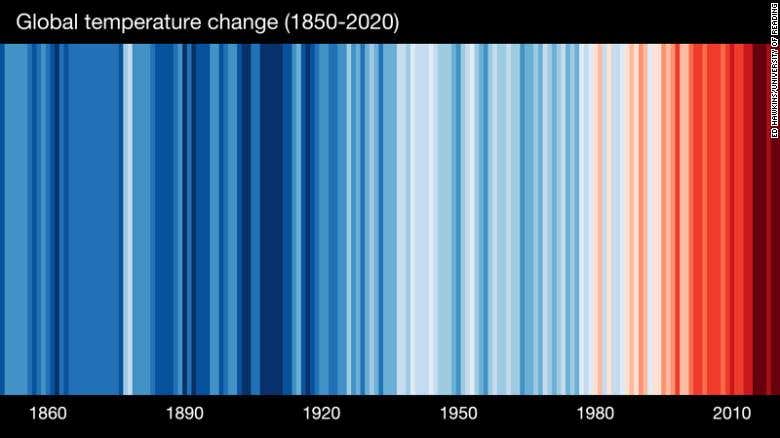
Global Stripes
Globally the trend is obvious. Over the past 20 years, it’s hard to disagree that there isn’t something happening here. We’ve replaced the dark blues we saw in the early 20th century with dark reds that indicate some of the hottest years on record. Five of which have happened in the past decade. It’s a change that’s crystal clear in this graphic, which is exactly what it was designed for. Professor Hawkins’s goal was to create a simple, easy to understand graphic that could be used in just seconds to show the overwhelming change in our climate.
US Stripes
Compared to the global stripes there is a fair amount of variability in our local climate stripes. This is common when looking at data over a smaller area, trends won’t be as smooth since overall you’re working with less data.
The variability between warmer and cooler may seem chaotic, but a pattern does emerge when you look close enough. Warmer and cooler colors are mixed together all the way through some stretches are longer than others overall though they even themselves out. Until you make it to the early 2000s. Once you get past there the cooler colors fade and are almost entirely replaced by shades of red and orange. A shift that is very similar to what has been observed globally, happening right in our backyard.
Your Carbon Footprint
According to Climate Central, your carbon footprint is defined as: “…the amount of carbon (in the form of carbon dioxide, or CO2) you send into the atmosphere in the process of living your life.” [What is your carbon footprint?] Carbon Dioxide as many know is one of the most common greenhouse gases (GHG) that contributes to human-induced climate change, also known as anthropogenic climate change.
Globally, the average carbon footprint is about five and a half tons of carbon per person per year. That sounds like a lot, but keep in mind the average American has a carbon footprint of 16 tons per year according to The Nature Conservancy.
There are a few ways you can reduce your carbon footprint such as:
Reducing your consumption of meat
Biking or walking to destinations close to home/work instead of driving
Using cold/cool water instead of hot when showering, doing laundry, etc…
Putting your thermostat up during the summer and down during the winter
You can calculate your own approximate carbon footprint on the EPA’s website.
Like these kind of feel good stories? Get the Brighter Side of News' newsletter.
Tags: #Green_Good_News, #Climate_Change, #The_Brighter_Side_of_News