Popular bottled water brands linked to unexpected microplastic exposure
Bottled water samples held up to 11.5 million particles per liter, with nanoplastics making up most of the count.

 Edited By: Joseph Shavit
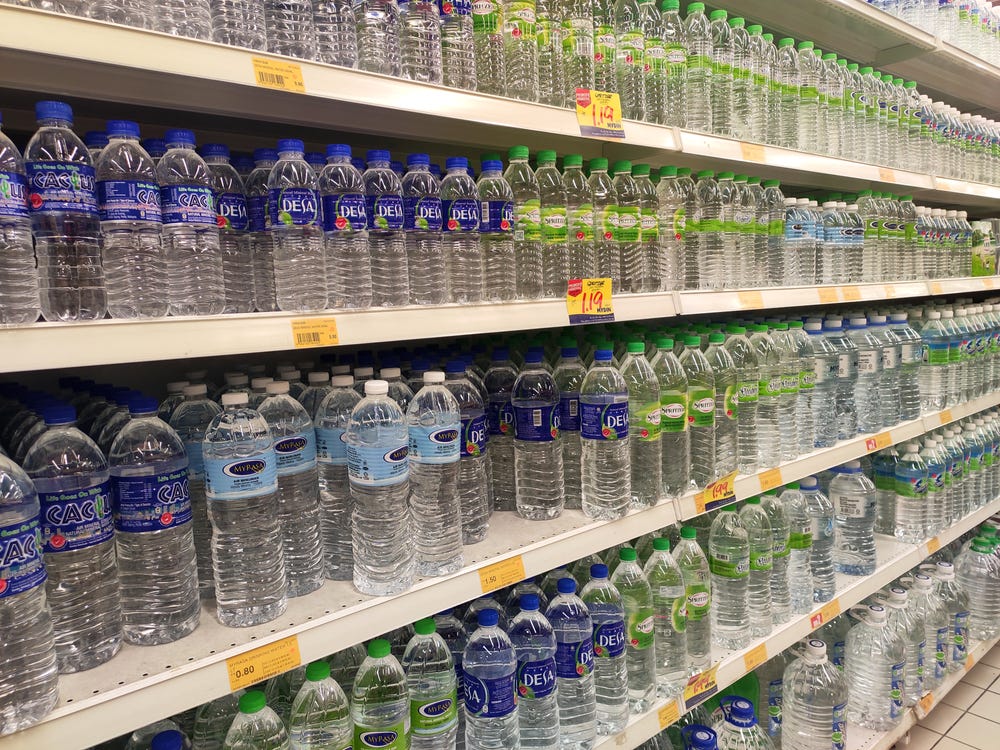
New measurements find bottled water can carry far more nanoplastic particles than treated tap water, though mass differs. (CREDIT: Shutterstock)
Up to 11.5 million plastic particles can show up in a single liter of bottled water, at least in a small slice of samples tested by a team working near Lake Erie.
That headline number comes from counting not just microplastics, but far smaller pieces called nanoplastics, which are under 1 micrometer. In this study, bottled water carried significantly higher particle counts than treated tap water, even though the tap water came from conventional treatment plants.
The work also points at a quieter issue: many past surveys likely missed a large share of plastic contamination simply because they could not see particles this small.
A closer look at bottled water and the tap
The scientists analyzed six brands of bottled water and water from four drinking-water treatment plants along the Ohio shore of Lake Erie. Those plants used conventional steps such as coagulation, flocculation, sedimentation, and granular media filtration.
When the team compared the two sources using the same measurement approach, bottled water came out higher on particle count. Treated drinking water ranged from 1.6 to 2.6 million particles per liter. Bottled water ranged from 2.6 to 11.5 million particles per liter.
Nanoplastics made up a large share in both. More than half of the particles in treated drinking water were nanoplastics. Bottled water averaged 66% nanoplastics.
The difference in particle concentrations between bottled and treated drinking water was statistically significant (p = 0.019).
Megan Jamison Hart, the study’s lead author and a Ph.D. candidate in environmental sciences at The Ohio State University, framed the everyday takeaway in plain terms. “We can make educated choices to try and reduce our daily exposure to these harmful chemicals,” Hart said. “For the average person who is thirsty and wants a drink, the best way to do that would be drinking it straight out of the tap rather than grabbing pre-bottled water.”
The study appeared in Science of the Total Environment.
Tools built for the smallest fragments
Nanoplastics create a measurement problem. Their size makes them hard to isolate, hard to image, and hard to identify by polymer type. That gap helps explain why so much prior work focused on larger microplastics.
This team built a workflow that pushed the detection limit much lower than common vibrational spectroscopy approaches. They report quantifying particles down to 300 nanometers and identifying polymer type down to 500 nanometers.
Their process used chemical oxidation to remove organic material, then vacuum filtration, resuspension, and a density separation step accelerated by centrifugation. The study describes adjusting density with a zinc chloride solution and centrifuging for 92 hours to separate plastics from inorganic debris. The team then analyzed the captured particles with scanning electron microscopy for size and counts, and optical photothermal infrared spectroscopy for chemical identification.
They validated the method using polystyrene nanoplastic spheres. Recovery efficiency was 81 ± 1% in filtered deionized water, and 80% in an “environmentally relevant” test using Olentangy River water amended with the same spheres. Their negative controls showed low plastic content, made up almost entirely of nanoplastics, which the authors take as evidence that contamination from processing was negligible.
More particles, but not more mass
One of the more counterintuitive results sits in the mass estimates. Bottled water had more particles, yet treated drinking water often had higher mass concentrations.
Estimated mass concentrations in treated drinking water ranged from 2.0 to 14.7 micrograms per liter, averaging 6.8 micrograms per liter. Bottled water ranged from 0.62 to 4.0 micrograms per liter, averaging 2.16 micrograms per liter.
Nanoplastics drove particle counts, but they barely moved the mass totals. The study reports that nanoplastics contributed less than 5% of the total plastic mass in both sample types, because larger microplastics carry far more volume.
The authors also describe a practical reason for wide variation in mass estimates. Large particles were uncommon, but when they appeared in an imaged segment, they dominated the calculated volume. In one bottled-water sample, a single 11-micrometer particle accounted for most of the calculated volume in one image, and a large share of the sample’s total across images.
John Lenhart, the study’s senior author and a professor of environmental engineering at Ohio State, said the ability to include nanoplastics changed the picture. “The concentrations we saw were higher than anticipated, which, unlike prior studies, we were able to attribute to the inclusion of the nanoplastics,” Lenhart said. “That emphasis validates a lot of the information we’ve learned.”
Where the plastics might be coming from
The polymer mix differed by source, and it hints at where some particles may originate.
In bottled water, polyethylene terephthalate (PET) showed up as the most common polymer, followed by polyamide (PA) and rubber. All six bottled-water brands used PET bottles with PET or polyethylene (PE) caps, and PE mattered in two of the six samples.
Those facts line up with the study’s suggestion that packaging likely introduces some plastics. The authors also note another potential pathway: PA is used in reverse osmosis and filtration membranes, and PA appeared in high abundance across bottled-water samples.
In treated drinking water, PA was the most common polymer identified. Rubber and “PES” (polyesters, including PET) followed at similar proportions. The study says the source of plastics in drinking water remains unclear. The authors point to possibilities inside treatment systems, but they also note that plastics could simply persist from the source water.
Concerns and limitations
Rubber stands out in the findings because many drinking-water studies rarely report it. The authors suggest this may reflect how some studies define plastics and what their identification tools can classify.
The study also flags an important methodological concern. Agitation and ultrasonication, used during processing, may have caused additional fragmentation or disrupted aggregates, potentially inflating nanoplastic counts. The paper describes this as an area for future work.
Other limitations are straightforward. The team analyzed each bottled-water brand once, and they analyzed drinking-water samples in duplicate. The mass estimates rely on shape and density assumptions that can introduce bias, especially for irregular, weathered particles. Finally, the reported concentrations are minimums because the method still has a lower detection and identification boundary.
Research findings are available online in the Science of the Total Environment.
The original story "Popular bottled water brands linked to unexpected microplastic exposure" is published in The Brighter Side of News.
Related Stories
- Microplastics are filling the deep ocean faster than scientists feared
- High school student develops inexpensive way to remove microplastics from drinking water
- Scientists Discover a Simple Trick to Eliminate Microplastics From Tap Water
Like these kind of feel good stories? Get The Brighter Side of News' newsletter.
Joshua Shavit
Writer and Editor
Joshua Shavit is a NorCal-based science and technology writer with a passion for exploring the breakthroughs shaping the future. As a co-founder of The Brighter Side of News, he focuses on positive and transformative advancements in technology, physics, engineering, robotics, and astronomy. Joshua's work highlights the innovators behind the ideas, bringing readers closer to the people driving progress.