Two-tiered atlas of the developing human brain offers new hope in Parkinson’s treatment
Two-step brain atlas grades midbrain cell models, boosting Parkinson’s research and safer, future cell therapies.

 Edited By: Joseph Shavit
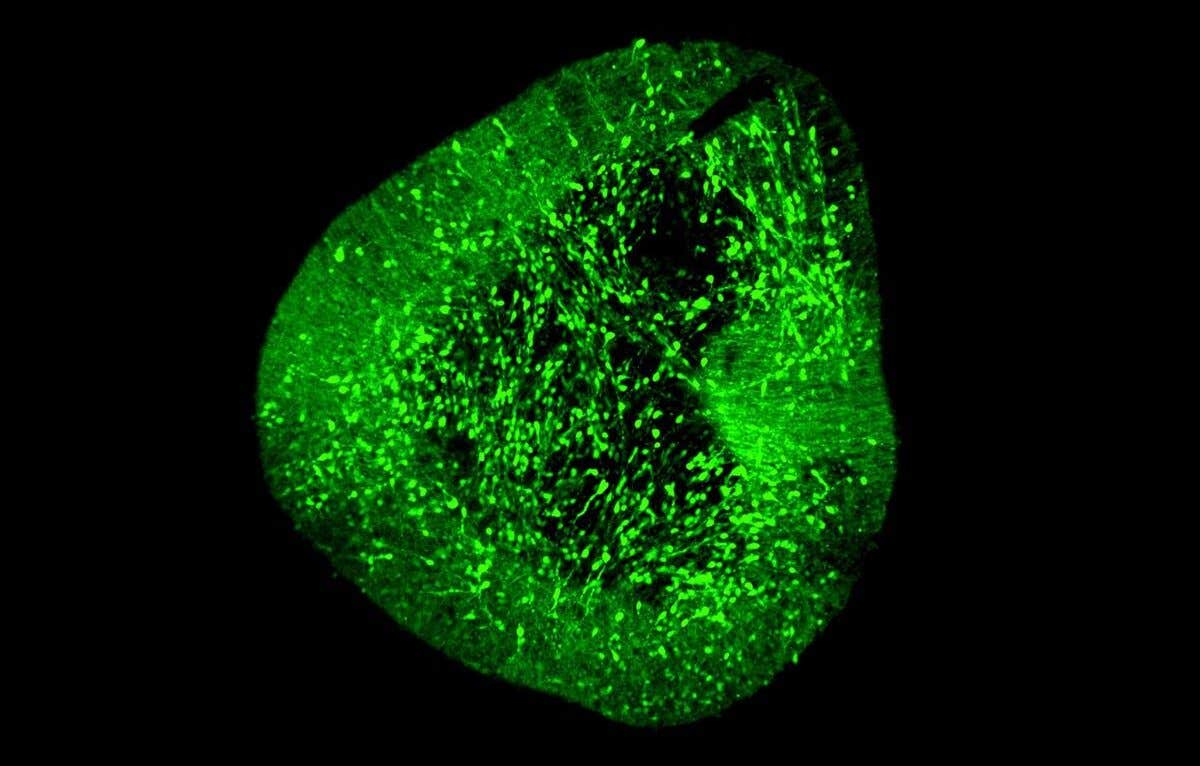
Midbrain dopaminergic neurons under a microscope. (CREDIT: Hilary Toh, Duke-NUS Medical School)
Parkinson’s disease steals ease and movement by striking a narrow band of midbrain neurons. If you study or cover neuroscience, you have seen the promise and frustration in efforts to grow these dopaminergic cells in dishes. Results jump around, identities blur, and stray cell types creep in. Now you can point to a clearer way forward.
Scientists from Duke-NUS Medical School have built a two-tier single-cell atlas of the developing human brain and a tool to grade how faithfully lab-grown cells match the real midbrain. The approach gives you a practical scoreboard for models, and a path to better therapies down the road.
Two Atlases, One Goal
The team first created a comprehensive fetal whole-brain atlas, then a high-detail map focused on the midbrain. They integrated two large human datasets profiling weeks 3 to 14 after conception, standardizing labels and markers across 679,666 cells from 39 donors. Neurons, neural progenitors, and non-neural classes were defined with care. Among neurons, transmitter-based groups such as dopaminergic, glutamatergic, GABAergic, serotonergic, and cholinergic were distinguished alongside other marker-defined types.
To test how well cell identities encode where they come from, the researchers trained a k-nearest neighbor classifier on region labels. Midbrain dopaminergic neurons scored 0.92 for region specificity, while forebrain glutamatergic neurons hit 1.0. Some groups showed weak regional ties, like forebrain serotonergic neurons at 0.08, which warns you not to overread location from type alone. The team also found 21 midbrain markers for dopaminergic identity that include EN1 and PITX3, plus less familiar genes like ELOVL3 and MYRIP.
A Sharper Look at the Fetal Midbrain
The midbrain subatlas assembled 102,335 cells across weeks 3 to 14, adding an independent ventral midbrain dataset to widen coverage. Six progenitor subtypes were mapped to downstream lineages that include dopaminergic, red nucleus, ventral and dorsal GABAergic, glutamatergic, and a mixed dopaminergic or subthalamic nucleus fate.
Trajectory analysis of ventral cells revealed four branches that end in dopaminergic neurons, red nucleus neurons, ventral GABAergic neurons, and a hybrid dopaminergic or subthalamic lineage. Classical floor plate genes such as LMX1A and SOX6 traced dopaminergic precursors, while TH and KCNJ6 marked maturing dopaminergic cells.
One small but important group stood out. A dopaminergic-like cluster with subthalamic features, labeled hDA.STN, could be mistaken for the target cell type in culture. PITX2 marked these subthalamic-related cells, and the team showed that hDA cells enrich for axon growth and dopamine metabolism, while hDA.STN cells tilt toward protein translation and folding. Signaling cues also differed, with EPHA and Netrin pathways specific to hDA. If you work with midbrain models, these differences matter for purity and function.
BrainSTEM: Two-Step Map and Measure
With both atlases ready, the group introduced BrainSTEM, a mapping framework that first projects any lab dataset onto the whole brain, then zooms in on midbrain-like cells for fine classification. This workflow prevents the common mistake of calling a culture “midbrain” when it leans toward forebrain or hindbrain.
The authors curated more than 1.4 million cells across 50 conditions from 12 published datasets plus one in-house organoid protocol. They compared 2D and 3D systems, tracked time points, and built synthetic mixtures to stress-test the method.
In real datasets, the first mapping tier showed that off-target forebrain and hindbrain cells often make up more than half of samples labeled as midbrain. The in-house organoids and one 2D protocol yielded the highest shares of true midbrain cells. Across time series, midbrain-like cells often peaked between days 30 and 40. Organoids reached about 25 to 35 percent midbrain identity at best time points. One 2D protocol sometimes exceeded that, though many midbrain-labeled cells were progenitors rather than neurons.
Dopaminergic purity tracked with a gene signature score, and higher scores aligned with more dopaminergic neurons, with Spearman correlations over 0.7. Some protocols showed rising serotonergic signatures by day 45, a sign of excess caudalization that pushes cells toward hindbrain fates.
The Whole Brain Filter
After the whole-brain filter, seven datasets had enough midbrain-like cells to enter the second tier. Here, the subatlas parsed fine-grained progenitor and neuron identities and showed a mix of dopaminergic, ventral GABAergic, and glutamatergic lineages across protocols.
To capture ventral identity, the team trained a random forest that generated a ventral score per cell. Cultures rich in dopaminergic cells tended to have higher ventral scores, aligning with a floor plate trajectory. The group then compared each protocol’s cell mix with in vivo midbrain at specific gestational weeks. Many datasets matched weeks 6 to 8, while an organoid grown to day 120 correlated with weeks 10 to 11, hinting that longer culture nudges cells toward later fetal stages.
Crucially, a one-step direct mapping inflated dopaminergic counts by pulling in forebrain-like cells. The two-step BrainSTEM approach cut those false positives, making your readouts more trustworthy.
What This Means for Parkinson’s
If your work touches Parkinson’s disease, the message is plain. It is not enough for cells to look dopaminergic. They must also carry midbrain identity. BrainSTEM shows how often cultures drift, and it helps you see which knobs to turn. Across surveyed protocols, conditions that included FGF8 and used lower CHIR doses tended to improve dopaminergic output.
The atlas also flags rare, subthalamic-related cells that can skew results if you miss them. There are limits to consider. The references cover the first trimester, and predictions become less certain in later forebrain stages after week 17. Mature glia are sparse because they appear later in development. Extending the atlas into the second trimester and beyond would capture maturation and interactions tied to adult disease.
Part of a Larger Push to Chart the Brain
This work sits alongside the U.S. National Institutes of Health’s BRAIN Initiative Cell Atlas Network, an international effort to build a complete atlas of human brain cells. The latest collection of papers in Nature and related journals maps how cell types arise, specialize, and turn genes on or off across species.
“Our brain has thousands of types of cells with extraordinary diversity in their cellular properties and functions, and these diverse cell types work together to generate a variety of behaviors, emotions and cognition,” said Hongkui Zeng of the Allen Institute, who led two of the studies. UCLA neuroscientist Aparna Bhaduri added, “The developing brain is an incredibly enigmatic structure because it is hard to access, comprised of so many distinct cell types, and rapidly changing.”
These studies chart cell development in the neocortex and hypothalamus, among other regions, and even show that some brain tumors may hijack embryonic programs. The group identified new human cell types and highlighted slower, prolonged differentiation in the cortex that reflects long human development. The work aims to inform gene and cell therapies and deepen understanding of autism, ADHD, schizophrenia, and other conditions.
“First, by studying and comparing brain development in human and animals, we will better understand human specialization and where our unique intelligence comes from,” Zeng said. “Second, by understanding normal brain development in humans and animals, we will be better able to study what changes are happening in diseased brains.”
Voices from the BrainSTEM Team
Scientists from Duke-NUS Medical School and collaborators underscored the clinical stakes. “Our data-driven blueprint helps scientists produce high-yield midbrain dopaminergic neurons that faithfully reflect human biology. Grafts of this quality are pivotal to increasing cell therapy efficacy and minimizing side effects, paving the way to offer alternative therapies to people living with Parkinson’s disease,” said Dr Hilary Toh.
Senior author Dr John Ouyang noted, “By mapping the brain at single-cell resolution, BrainSTEM gives us the precision to distinguish even subtle off-target cell populations.”
Assistant Professor Alfred Sun said, “BrainSTEM marks a significant step forward in brain modelling. By delivering a rigorous, data-driven approach, it will speed the development of reliable cell therapies for Parkinson’s disease.” Professor Patrick Tan called the study a redefined benchmark and emphasized open access to the atlases and toolkit.
Research findings are available online in the journal Science Advances.
Related Stories
- Scientists produce the first brain-wide map of decision-making at the cellular level
- New brain map reveals neuron connections behind motor function
- Adults grow new brain cells well into their 70's, study finds
Like these kind of feel good stories? Get The Brighter Side of News' newsletter.
Rebecca Shavit
Writer
Based in Los Angeles, Rebecca Shavit is a dedicated science and technology journalist who writes for The Brighter Side of News, an online publication committed to highlighting positive and transformative stories from around the world. Her reporting spans a wide range of topics, from cutting-edge medical breakthroughs to historical discoveries and innovations. With a keen ability to translate complex concepts into engaging and accessible stories, she makes science and innovation relatable to a broad audience.