Antarctic meltwater is driving faster ice loss than climate models predict
Antarctic meltwater can alter ocean currents in ways that speed more ice loss, a new study finds.

 Edited By: Joseph Shavit
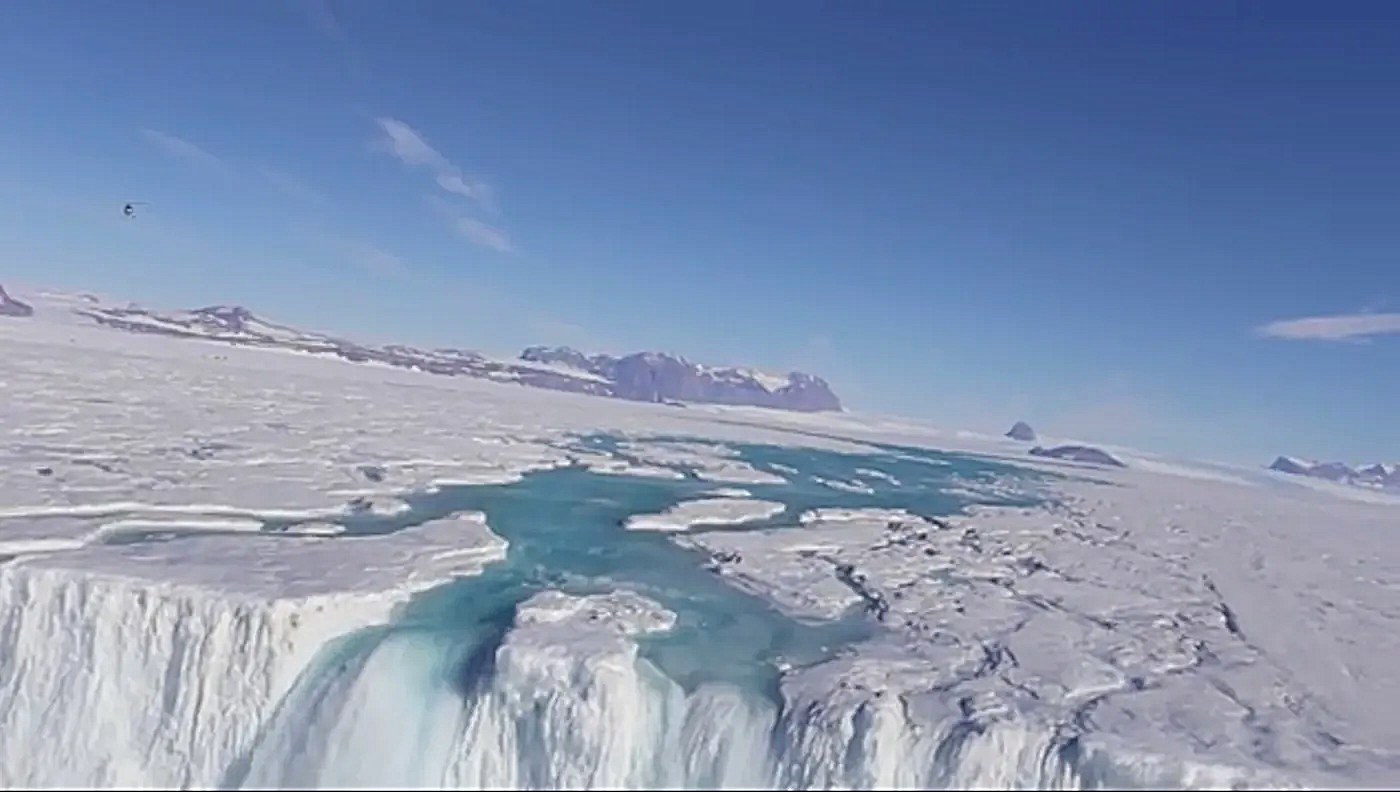
Antarctic meltwater may speed ice loss by reshaping ocean circulation, raising concerns that sea-level forecasts are too low. (CREDIT: Won Sang Lee/Korea Polar Research Institute)
The usual picture of Antarctic ice loss is simple enough: a warmer atmosphere melts more ice, and the oceans rise. This new research argues that the real story is less straightforward, and potentially more dangerous.
What melts off the ice does not just disappear into the sea as extra water. It changes the sea itself. In the new analysis, freshwater from Antarctica alters the density and circulation of the surrounding ocean in ways that can either speed up melting or briefly slow it, depending on where it happens. That means the ocean is not just responding to climate change. In some places, it is helping drive the next round of ice loss.
Madeleine Youngs of the University of Maryland and her colleagues found that this meltwater feedback accounts for a surprisingly large share of future Antarctic ice-shelf melt in their simulations. In the experiments, direct climate forcing produced about one-third of the total melt increase, while the feedback tied to meltwater and ocean circulation accounted for the other two-thirds.
“Most current climate models that inform international policy don’t consider this feedback loop at all. The Intergovernmental Panel on Climate Change (IPCC) treats melting as a fixed, rather than interactive input,” said Youngs, the study’s lead author and an assistant professor in UMD’s Department of Atmospheric and Oceanic Science. “We need to include ice shelf melt feedbacks when we’re estimating future ice shelf melt, the primary component of sea level rise, if we want the most accurate understanding of what’s going on.”
A barrier that does not always hold
Around Antarctica, cold, dense water can act like a protective wall. It settles near the seafloor and helps block warmer deep water from reaching the undersides of floating ice shelves. Those shelves matter because they help restrain the glaciers and ice sheets behind them.
Fresh meltwater weakens that barrier.
As the researchers describe it, extra freshwater dilutes the cold shelf waters, making them lighter and less able to keep warmer water out. Once that warmer water reaches the ice shelves from below, basal melt increases. Basal melt already makes up the largest share of ice-shelf mass loss, about 55%, slightly more than iceberg calving at 45%.
Then the cycle can feed itself.
“It’s a positive feedback loop where more melt leads to warmer water reaching the ice, which causes even more melt,” Youngs said. “If we [humans] continue to do business as usual, it’s a distinct possibility that we reach the climate tipping point sooner than later, especially as we consider this positive feedback loop.”
That process was especially strong in what the team calls dense shelf regions, including the Weddell Sea, the Ross Sea and Prydz Bay. In these places, the combination of climate forcing and meltwater changes weakened or even shut down the formation of Dense Shelf Water, a cold, salty water mass that normally helps hold warm currents back.
In the Weddell Sea, the effect was stark. The model showed bottom warming of roughly 2 degrees Celsius from the melt feedback alone, along with strong freshening and a major rise in melt. The equivalent total melt rate in that sector increased by 530 gigatons per year due to the feedback.
The study describes that as the kind of setup that could push a system past a threshold.
Not every vulnerable region responds the same way
Some of Antarctica’s best-known trouble spots behaved differently.
The downstream regions west of those dense shelf areas, including the Antarctic Peninsula, the Bellingshausen Sea and the Amundsen Sea, showed a more complicated pattern. These areas are usually seen as highly exposed because warm Circumpolar Deep Water can move onto the continental shelf and reach floating ice.
That still happened under direct climate forcing. In those regions, the model showed bottom warming of about 0.5 degrees Celsius and higher salinity as warm water intruded farther inland.
Yet when the researchers added the meltwater feedback, the response flipped. Freshwater from upstream spread westward along the coast, cooled the shelf waters, and helped trap warmer deep water offshore. In effect, meltwater created a shield.
“Our study suggests that these regions, usually regarded as the most at-risk, are actually more protected than we thought, at least in the short term, because of this negative feedback loop,” Youngs said. “But this protection depends on massive upstream melting happening first, and that upstream melt has its own severe consequences on sea levels.”
That short-term protection came with measurable decreases in equivalent melt in several downstream regions. The Antarctic Peninsula showed the strongest response, with a 197% reduction in the model’s equivalent melt rate. The Bellingshausen and Amundsen seas also showed declines.
So Antarctica is not behaving as one uniform block of ice.
The findings suggest that where a shelf sits in relation to major currents, and whether it lies downstream of heavy melt elsewhere, can change whether meltwater amplifies danger or temporarily muffles it.
Why this matters for sea-level forecasts
That regional split may help explain why sea-level projections still carry so much uncertainty.
The Antarctic Ice Sheet contains the planet’s largest potential freshwater contribution to sea-level rise. The East Antarctic Ice Sheet alone holds the equivalent of about 52 meters of global sea-level rise, while West Antarctica contains about 5 meters. Ice-sheet and ice-shelf modeling suggests Antarctica could contribute up to 1 meter of sea-level rise by 2100, though with large uncertainty.
The researchers argue that part of that uncertainty comes from how many climate models still treat ice-shelf melt as a fixed input instead of a changing part of the ocean system. In this study, that missing interaction turned out to be large enough to reshape the outcome.
Across the major shelf seas examined here, the forced climate response increased melt by about 274 gigatons per year. Melt feedbacks added another 531 gigatons per year. In other words, about 66% of the total melt increase came from the ocean-ice interaction itself.
That is a serious blind spot for places far from Antarctica.
More than 680 million people live in low-lying coastal zones vulnerable to sea-level rise. The IPCC estimates that Antarctic ice melt could add 28 to 34 centimeters to sea level by 2100 under high-emissions scenarios. If feedbacks like these are missing or underestimated, the reach of future flooding and storm surge could expand beyond what planners expect.
“This is really just a first investigation into this topic,” Youngs said. “What we’re showing is that the feedbacks in the Antarctic region are real, extremely impactful and vary depending on where they take place on the continent. We can’t just consider the direct impact of a warming atmosphere.”
The work also has limits. The experiments were short transient runs, focused on conditions from 2075 to 2094 under a high-end emissions scenario. The authors note that Antarctica’s coastal regions are highly varied, and some regional results, especially in the Ross Sea and Amery sector, need further investigation.
They also say future studies should better trace warm-water pathways, connect ocean feedbacks to ice-sheet dynamics, and measure the uncertainty around these effects by 2100 under different climate scenarios.
Practical implications of the research
The clearest takeaway is that future sea-level forecasts may miss an important driver if they leave Antarctic meltwater feedbacks out. This work suggests the ocean can either intensify ice loss or briefly buffer it, depending on location, and that those regional differences matter.
Better models could help scientists identify which ice shelves are approaching dangerous thresholds, improve long-range coastal planning, and sharpen estimates of how quickly Antarctica may add to rising seas in a warming world.
As Youngs put it, “The next step is understanding exactly when and where things tip, and what that means for all of us.”
Research findings are available online in the journal Nature Geoscience.
The original story "Antarctic meltwater is driving faster ice loss than climate models predict" is published in The Brighter Side of News.
Related Stories
- Antarctica’s ice shelves face a growing threat from warm waters below
- Three million years of climate history, captured in Antarctic ice
- Global first: A massive sleeper shark was filmed in cold Antarctic waters
Like these kind of feel good stories? Get The Brighter Side of News' newsletter.
Rebecca Shavit
Writer
Based in Los Angeles, Rebecca Shavit is a dedicated science and technology journalist who writes for The Brighter Side of News, an online publication committed to highlighting positive and transformative stories from around the world. Having published articles on MSN, AOL News, and Yahoo News, Rebecca's reporting spans a wide range of topics, from cutting-edge medical breakthroughs to historical discoveries and innovations. With a keen ability to translate complex concepts into engaging and accessible stories, she makes science and innovation relatable to a broad audience.