Supernovae help astronomers measure how the Universe expands over time
A new AI model helps astronomers use photometric supernova data to better track how the Universe expands.

 Edited By: Joshua Shavit
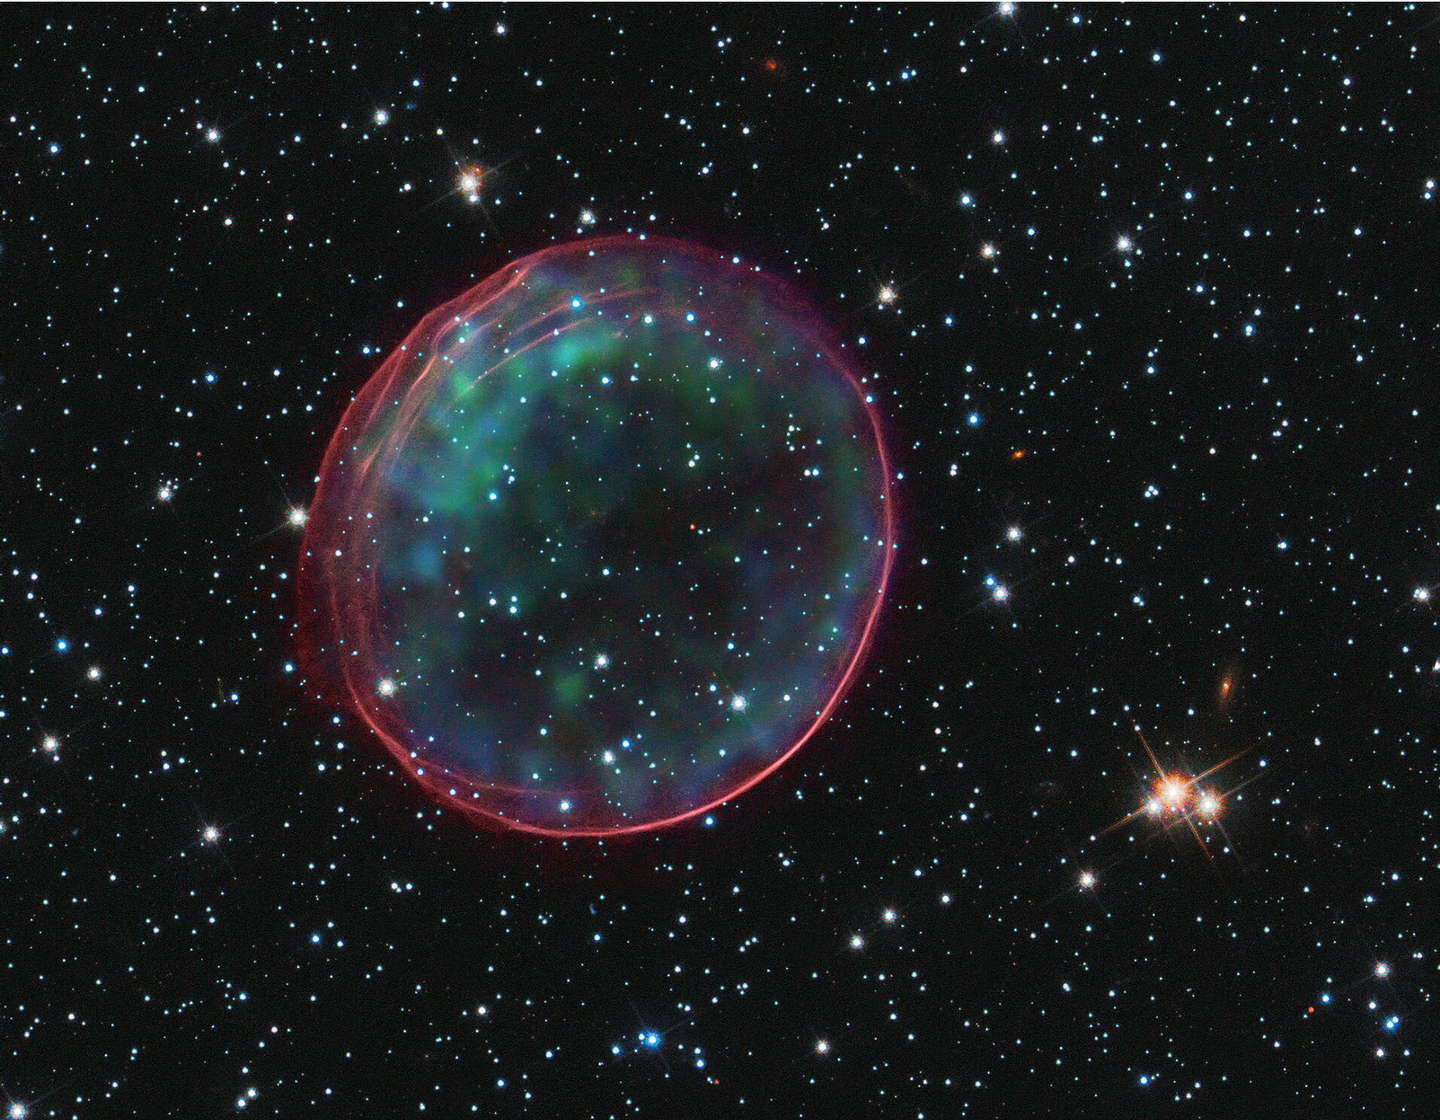
New AI method uses supernova brightness data to sharpen cosmic expansion measurements without relying on spectroscopy. (CREDIT: Wikimedia / CC BY-SA 4.0)
Astronomers have leaned on Type Ia supernovae for decades because these stellar explosions act like mile markers across the cosmos. You simply measure how bright one appears, and then compare that with how bright it ought to be. After that, you can estimate how far away it is. Additionally, when you stack enough of those measurements together, a picture of how the Universe has expanded over time begins to emerge.
That picture, though, is never as clean as it sounds.
The light from a supernova reaches Earth carrying more than one message at once. Part of it reflects the explosion itself. Part of it is shaped by the star that blew apart, including its age and chemical makeup. Another part has been dimmed or reddened by dust in and around the galaxy where the blast happened. And part of it has been stretched by the expansion of the Universe.
A new analysis from Konstantin Karchev and Roberto Trotta of SISSA, working with Raúl Jiménez of the University of Barcelona, tries to sort out those overlapping signals in one shot. Their method, called CIGaRS, uses artificial intelligence and neural networks to model supernovae together with the galaxies that host them. The goal is to pull apart intrinsic effects, tied to the exploding star, from environmental ones. For example, this includes dust and galaxy properties, all using photometric data alone.
That matters because the next generation of sky surveys will deliver more supernovae than traditional methods can realistically handle.
A coming flood of stellar explosions
Type Ia supernovae are especially useful in cosmology because they can be standardized. Their brightness is not perfectly uniform, but astronomers can correct for some of the variation and turn them into reliable distance indicators. The trouble is that current corrections are often blunt.
One of the most common is known as the “mass step.” Supernovae in heavier galaxies tend to look slightly different, on average, from those in lighter galaxies. Therefore, researchers apply a brightness correction based on whether the host sits above or below about 10 billion solar masses. It works as a practical fix, but it does not explain what is really driving the difference.
Galaxy mass is just a stand-in for a cluster of harder-to-measure factors, including stellar age, metallicity, star formation, and dust.
“Today, spectroscopy remains the richest tool for studying a supernova, because it allows us to see many details of its physics and of the environment in which it explodes,” Trotta said. “The problem is that collecting detailed, homogeneous spectra at multiple epochs for very large samples will be impossible, given the sheer volume of data expected in the coming years.”
That volume is about to rise sharply. The Legacy Survey of Space and Time at the Vera Rubin Observatory in Chile is expected to discover millions of supernova candidates over 10 years. Each year, it should detect at least 100,000 Type Ia events. Yet only a small fraction of them will have spectroscopic follow-up. In fact, the researchers note that roughly 1% are expected to have spectroscopic typing and redshift. Even with dedicated campaigns, only up to 10% of host galaxies may be followed up.
So the field faces a basic problem: either squeeze far more information from brightness measurements, or leave most of the coming dataset underused.
A model that treats the whole system together
CIGaRS, short for Combined Inference and Galaxy-Related Standardisation, was built to avoid the usual piecemeal corrections. Rather than handling dust, host-galaxy properties, supernova timing, and cosmology as separate steps, it folds them into a single forward model.
The framework combines galaxy evolution, dust extinction, cosmological distance, measurement noise, sample selection, and the rate at which Type Ia supernovae appear over time. It also includes the delay-time distribution. This describes how long it takes a star population to produce a Type Ia supernova after formation.
Rather than relying on traditional Markov chain Monte Carlo sampling, which the team describes as intractable in realistic scenarios, the new approach uses simulation-based inference. In practice, that means training neural networks on large sets of simulated examples. This way, the system learns how to work backward from observed light to the underlying physical and cosmological parameters.
The team tested the method first on a simulated catalogue of 1,578 selected supernovae, a size meant to resemble current flagship catalogues. They then scaled it to a second mock dataset nearly ten times larger, around 16,000 objects. This is roughly what Rubin might collect in a single month.
From those image-based inputs alone, CIGaRS was able to reconstruct several intertwined quantities at the same time. These included cosmological parameters tied to the expansion of the Universe, the delay-time distribution, and host-related influences such as stellar age, metallicity, and any remaining mass-step effect.
What the simulations showed
The model reproduced an important distinction that simpler corrections tend to blur.
According to the simulations, metallicity and age do not leave the same signature in the data. A progenitor star’s chemical composition tends to create something that looks like the familiar mass step. Specifically, this is a smoothed jump in brightness around a host mass of about 10 billion solar masses. Age behaves differently, producing a more gradual, roughly linear trend with stellar mass.
That difference matters because it suggests the usual mass-step correction can mix together multiple physical causes.
At the same time, these host-related effects are small. The analysis found they are weaker than other sources of scatter, especially supernova color and dust. That helps explain why standard techniques struggle to separate them cleanly.
The method also produced unusually strong photometric redshift estimates as a by-product. In the 1,578-object test sample, the median posterior standard deviation was about 0.01, with no outliers larger than an absolute redshift error of 0.1. The authors say that rivals analyzes using much broader ultraviolet-to-infrared coverage and improves on the roughly 0.04 scatter expected from Rubin photometry alone.
For cosmology, the gains are substantial. Compared with methods that depend on the small subset of supernovae observed spectroscopically, the researchers estimate that applying CIGaRS to large photometric-only samples could sharpen cosmological constraints by about a factor of four. In the larger mock catalogue, one-dimensional credible intervals became about three times narrower. At the same time, two-dimensional parameter regions shrank by a factor of ten.
In plain terms, the approach could help astronomers stop throwing away most of the value in a survey.
“With next-generation surveys, we will have enormous numbers of supernovae, datasets so rich that they can no longer be analyzed using traditional methods,” Trotta said. “What we need, therefore, are new methods capable of analyzing these large catalogues in a robust way, not only to extract ever more information, but also to turn those data into new physics.”
Practical implications of the research
The immediate payoff is efficiency. If future surveys detect huge numbers of Type Ia supernovae but obtain spectra for only a tiny minority, a method like CIGaRS could let astronomers use nearly the full sample rather than leaning on a narrow slice. That would improve measurements of cosmic expansion without waiting for costly follow-up campaigns that cannot keep pace with the data.
The work also has a second payoff. By modeling host galaxies and supernovae together, the framework may help settle long-running arguments over whether differences in supernova brightness come mainly from dust, progenitor age, metallicity, or some remaining mass-related effect. Better answers there would improve both supernova physics and dark energy studies.
The authors are careful not to oversell it. Their current analysis depends on a constrained modelling framework that may not fully match reality. They note that assumptions about ingredients such as the stellar initial mass function, stellar isochrones, and dust-extinction laws can bias global results, especially as datasets become larger and more precise. Still, they argue that simulation-based inference offers a practical way to test those choices and fold such uncertainties into the analysis as nuisance variables.
That may be the bigger shift here. The coming era of astronomy will not just bring more objects to count. It will demand new ways to reason through tangled, imperfect, high-volume data. Supernova cosmology is becoming a test case for that future.
Research findings are available online in the journal Nature Astronomy.
The original story "Supernovae help astronomers measure how the Universe expands over time" is published in The Brighter Side of News.
Related Stories
- Our local universe’s expansion rate doesn’t add up, astronomers find
- Scientists develop a new way to measure the expansion rate of the universe
- New gravitational lens measurements reveal a faster expansion rate for the universe
Like these kind of feel good stories? Get The Brighter Side of News' newsletter.
Joseph Shavit
Writer, Editor-At-Large and Publisher
Joseph Shavit, based in Los Angeles, is a seasoned science journalist, editor and co-founder of The Brighter Side of News, where he transforms complex discoveries into clear, engaging stories for general readers. With vast experience at major media companies like The Los Angeles Times, Times Mirror and Tribune Publishing, he writes with both authority and curiosity. His writing focuses on space science, planetary science, quantum mechanics, geology. Known for linking breakthroughs to real-world markets, he highlights how research transitions into products and industries that shape daily life.