
UC Irvine’s new map predicts which California homes are most likely to burn in a wildfire
An analysis of 100,000 inspections identifies where California buildings face the greatest wildfire damage risk.

 Edited By: Joseph Shavit

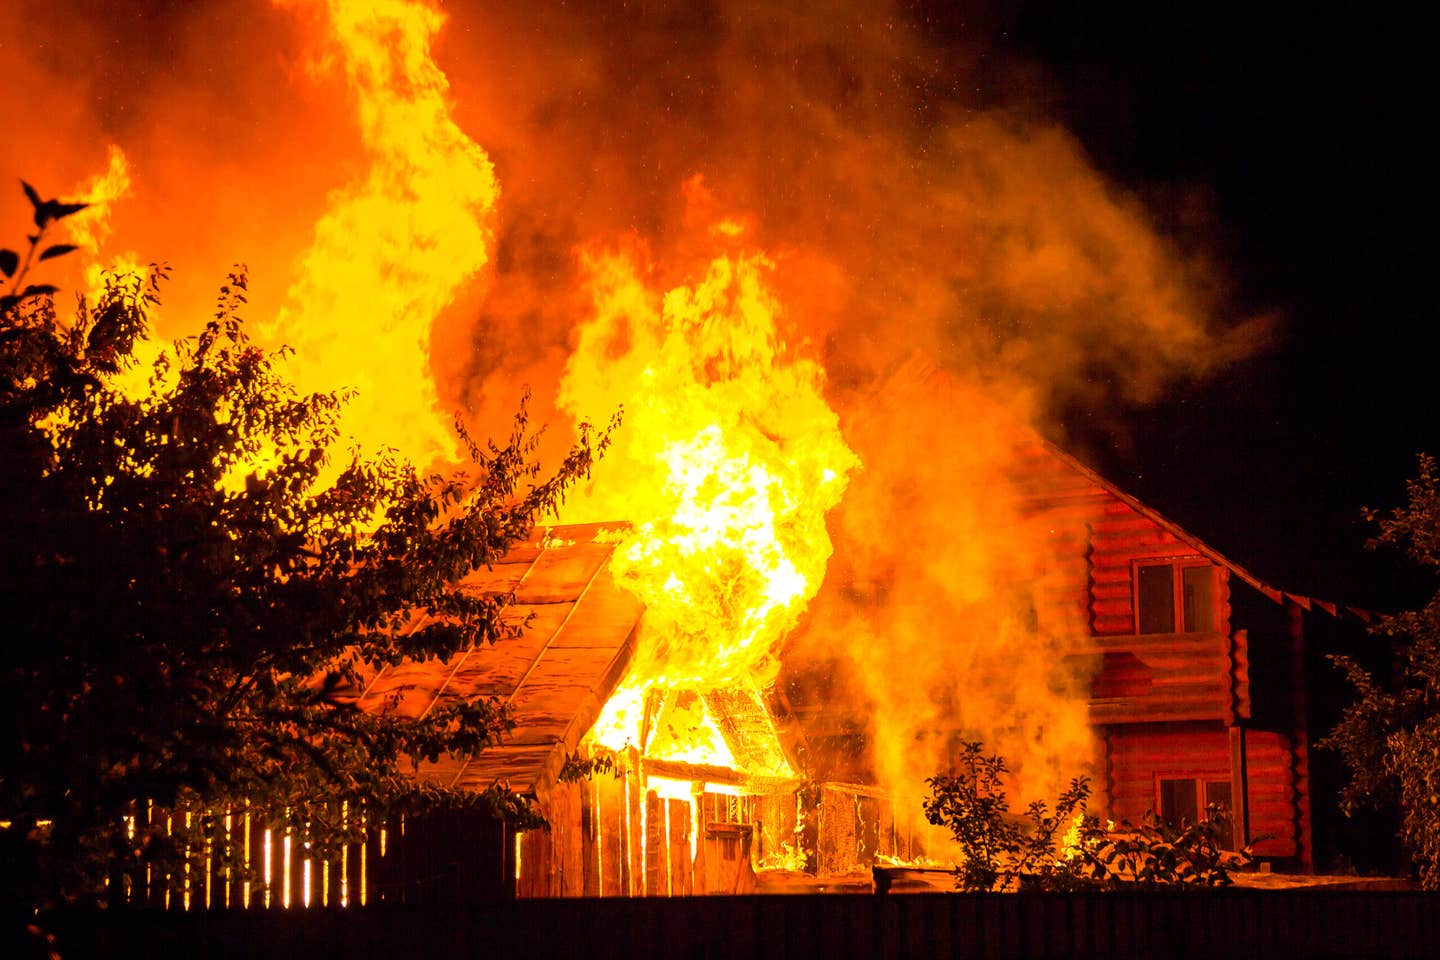
UC Irvine engineers analyzed 100,000 inspections to map which California homes are most likely to be destroyed by wildfire. (CREDIT: Shutterstock)
- UC Irvine engineers studied 100,000 building inspection records from California wildfires between 2013 and 2024 to figure out why some homes burn down and others don't.
- They found that dry, windy weather combined with things like wooden fences, flammable siding and open eaves make a home much more likely to be destroyed, and used this to build a detailed statewide risk map.
- The map can help homeowners and officials know where fire prevention efforts, like fireproofing fences and vents, would do the most good.
When a wildfire burns through a neighborhood, some houses survive and others don't, and it can look like pure chance. A new analysis of 100,000 building inspections says the pattern isn't random. Researchers in California say they can now predict, with striking accuracy, which homes are most likely to burn.
The team, based in UC Irvine's Department of Civil and Environmental Engineering, studied California Department of Forestry and Fire Protection inspection records from 2013 to 2024. Over that span, nearly 55,000 buildings were destroyed or partially damaged by fire. Eighty-six percent of those structures sat in wildland-urban interface zones, where development presses up against wild landscape. The findings are published in the journal Science Advances.
"We uncovered predictable features in how buildings are destroyed in California's wildfires, which shows that the damage pattern is not random," said lead author Somnath Bar, a UC Irvine postdoctoral scholar in civil and environmental engineering. "We have found that by identifying the precise combination of structural, environmental and weather factors involved, we can establish a comprehensive, physically interpretable framework to explain, model and project which buildings are most likely to be damaged or destroyed by fire."
Dry air and wind set the stage
The researchers point to low dew-point temperatures, which signal unusually dry air, as a major warning sign. Paired with high wind speeds, that dryness can sharply raise the odds that a fire will destroy nearby property. California's grasslands, mesic chaparral and mixed oak woodland act as the fuel that carries flames from wildland out toward buildings.
Destroyed buildings in the study clustered at fairly consistent elevations, typically around 522 meters, on gentle to moderate slopes rather than steep terrain.
More homes now sit in that path than in the past. Construction in the wildland-urban interface grew by roughly 33 percent nationwide between 1990 and 2010, adding more than 12 million structures. Between 2020 and 2022, over 80 percent of new California homes went up in high fire-risk areas, often on the moderate, wind-funneling terrain the researchers identified.
What actually catches fire
Beyond location, the way a home is built matters. Wooden fences, flammable siding, and protruding eaves and vents can all catch drifting embers.
"Fire risk is compounded when these building practices come face to face with environmental factors like atmospheric aridity, high heat, wind, and dry fuels such as trees, shrubs and grasses," said co-author Tirtha Banerjee, a UC Irvine associate professor of civil and environmental engineering.
The Palisades and Eaton fires in Southern California offered a stark example. In January 2025, they destroyed more than 16,000 structures, driven by Santa Ana winds moving through forests, sloped terrain and canyons that channeled and accelerated the airflow.
A map built from three growing models
To turn these patterns into something usable, the team built the Wildfire Building Damage Risk Index, a first-of-its-kind map covering California at 100-meter resolution. It blends satellite-derived environmental data, fire-weather analysis and building-level construction details in a machine learning system.
The system draws on more than a decade of real-world damage records, a depth of data earlier fire-risk tools generally lacked.
The researchers tested three versions of the model, each adding more information, from building flammability ratings to weather variables to broader environmental exposure. The most complete version reached 88 percent prediction accuracy, giving Bar and his colleagues a practical tool for forecasting risk, planning defensible space and designing more fire-resilient infrastructure.
"Local jurisdictions and homeowners can use the WBDRI map to prioritize defensible space inspections and fuel reduction investments in zones where the probability of damage exceeds 0.55, the threshold where the return on investment for structural hardening and vegetation management is highest," Bar said.
Homeowners aren't powerless
In the underlying data, fencing material carried the single largest weight in predicting a building's vulnerability, followed by exterior siding, the age of the building and roof material.
"The strong influence of building flammability on damage tells us something encouraging: Homeowners and communities are not powerless," Bar said. "Replacing wood fencing, upgrading siding to noncombustible materials, retrofitting eaves and installing ember-resistant vents can substantially reduce the probability that a structure is lost in a wildfire."
That lines up with other research cited in the study, which found that enclosed eaves, ember-resistant vent screens and multipane windows offer real protection against embers and radiant heat.
From household choices to statewide policy
Bar said the findings apply at several scales at once. State agencies could fold the risk map into land-use planning, insurance pricing and emergency management. Local fire agencies could use it to decide where mitigation spending does the most good. Individual households get a concrete checklist, starting with fences, siding, eaves and roofing.
The findings also echo a 2024 state law, SB 504, which requires a 5-foot ember-resistant zone around structures, consistent with the study's finding that nearby vegetation sharply raises risk.
"As fire season stretches longer into the year and blazes devastate communities across California, the need for precise, actionable fire risk data has never been greater," said Assemblywoman Cottie Petrie-Norris, D-Irvine. "Good policy starts with good data. UC Irvine's new fire risk map gives California exactly that – a clear picture of where the danger is greatest, so we can invest in smarter building practices, targeted fuel reduction, and data-driven planning before disaster strikes rather than after."
Practical implications of the research
The risk map gives officials and residents a way to act before a fire starts rather than after one ends. In the highest-risk zones the model identifies, fuel reduction and structural upgrades appear to offer the strongest return on investment, information that could help governments and insurers target limited resources precisely.
For homeowners, the findings point to a specific list of upgrades, replacing wood fencing, switching to noncombustible siding, retrofitting eaves and installing ember-resistant vents, that meaningfully lower the odds a home is lost.
The researchers say the next step is pairing this data with stricter building codes, land-use planning and active vegetation management across the wildland-urban interface.
Research findings are available online in the journal Science Advances.
The original story "UC Irvine's new map predicts which California homes are most likely to burn in a wildfire" is published in The Brighter Side of News.
Related Stories
- Wildfire smoke linked to higher assault rates, study finds
- AI drone swarms revolutionize wildfire detection and air quality monitoring
- Smartphones can predict wildfires and extreme weather conditions
Like these kind of feel good stories? Get The Brighter Side of News' newsletter.