MeerKAT finds ancient hydrogen clusters, offering a new way to chart the Universe
MeerKAT recovered the clustering pattern of faint hydrogen emission from around 4.5 billion years ago. Comparing independent radio maps helped separate the signal from brighter foregrounds and instrumental effects, advancing a route to much larger cosmic surveys.
 University of Manchester Writer: Jessica Marsh

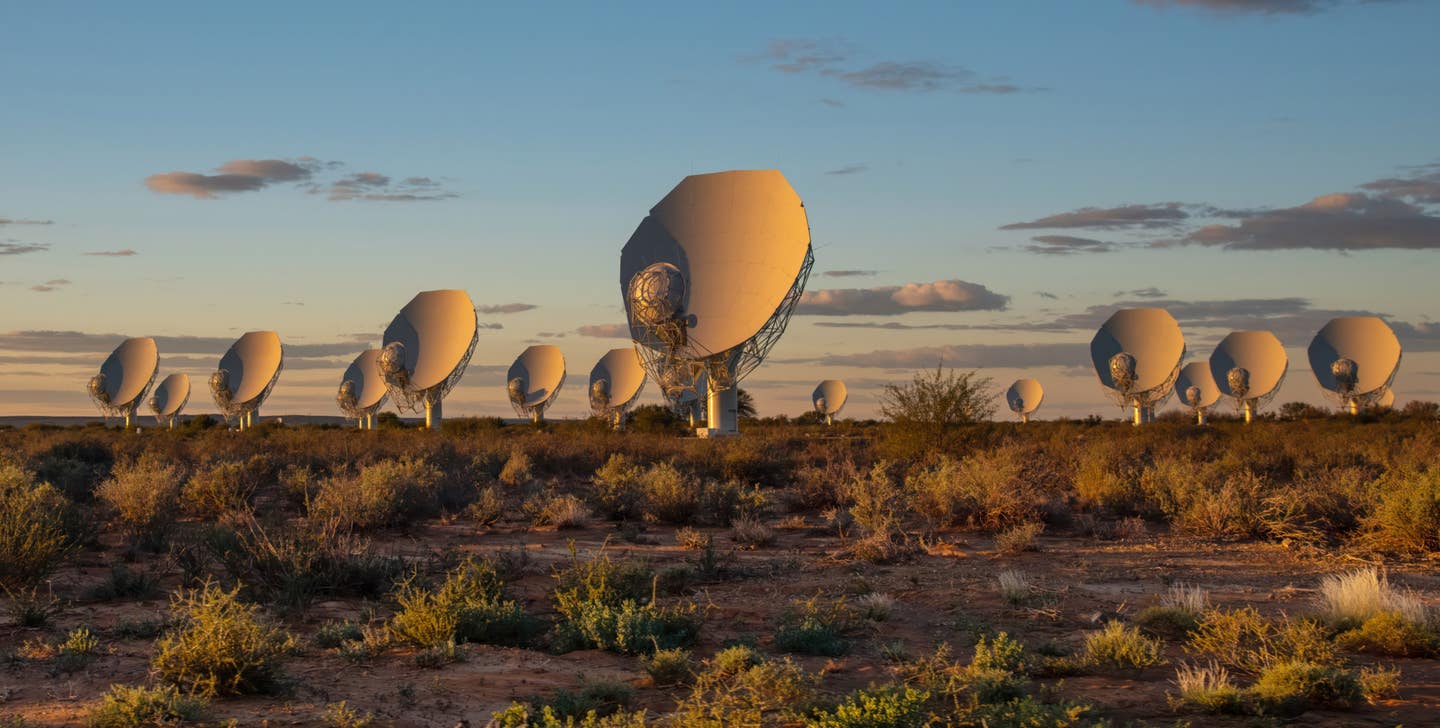
The MeerKAT radio telescope, located in South Africa’s remote Karoo semi-desert, consists of 64 interconnected antennas that work together to observe the universe in radio wavelengths. (CREDIT: SARAO)
Hydrogen in distant galaxies sends out a faint radio signal that carries a record of where matter gathered billions of years ago. Picking up that collective glow could give astronomers a way to chart enormous stretches of the Universe. South Africa’s MeerKAT telescope has now taken an important step by measuring how that hydrogen clusters across the cosmic web.
The MeerKAT Large Area Synoptic Survey, or MeerKLASS, collaboration reports the measurement in Monthly Notices of the Royal Astronomical Society. The international team includes researchers at The University of Manchester. Its approach, called 21-centimeter intensity mapping, measures combined emission from many galaxies, extending efforts in hydrogen mapping.
“This is a major milestone after a decade of preparation and hard work,” said Laura Wolz, MeerKLASS deputy principal investigator and Reader at Manchester’s Jodrell Bank Centre for Astrophysics. The detected signal comes from around 4.5 billion years ago, when the Universe was a little over nine billion years old. It provides a statistical view of matter’s distribution during that earlier chapter of cosmic history.
Reading the glow of many galaxies
Neutral hydrogen emits radio waves at a characteristic wavelength of about 21 centimeters. As the Universe expands, that radiation stretches, arriving at Earth at longer wavelengths and lower frequencies. Measuring its frequency therefore helps astronomers place the emitting gas at different distances and times. This stretching is called redshift, and it connects a radio measurement to the history of cosmic expansion.
That supplies the depth needed for three-dimensional maps. Sky position gives two dimensions; frequency adds the third. By comparing emission across positions and frequencies, researchers can study how hydrogen fills a volume of space.
Ordinary galaxy surveys often build catalogs of individually detected objects. Intensity mapping instead adds together the emission within larger patches. Losing the identities of individual galaxies allows the technique to capture their combined contribution across a broad survey region.
For this measurement, the researchers analyzed frequencies from about 971 to 1,024 megahertz, corresponding to an effective redshift of 0.42. The resulting pattern traces clustering on cosmological scales. It offers a way to study the larger network in which galaxies gather without resolving every member.
Putting 64 dishes to a different task
MeerKAT normally combines signals from its dishes as an interferometer, an arrangement useful for producing detailed radio images. The MeerKLASS measurements used its 64 antennas in single-dish mode. Each dish recorded the sky independently, favoring broad-area sensitivity and survey speed over fine angular detail.
That flexibility gives the radio telescope another way to explore distant objects and gas. For the hydrogen survey, the dishes swept back and forth across the observing region. Repeated passes produced measurements that the team could divide and compare.
The survey region is described as roughly 250 square degrees, about the area of 1,250 full moons. The paper’s final analyzed footprint covered approximately 236 square degrees. Both figures describe a broad patch of sky whose faint radio signals required careful calibration.
The observations came from MeerKLASS’s 2021 campaign, with about 60 hours of observing time. Removing data affected by radio-frequency interference reduced that to roughly 40 hours. The achievement therefore depended on making those retained measurements trustworthy as well as collecting them.
Finding a whisper beneath the foreground
The hydrogen emission sits beneath much brighter radio sources. Foreground radiation can be about 10,000 times stronger than the target signal, making subtraction a central challenge. “It is a little like trying to make out a whispered conversation from the front row of a roaring rock concert,” Wolz said.
Simply averaging the observations together would leave the researchers vulnerable to persistent contamination. Instead, they divided the data into observationally independent subsets and cleaned each separately. This builds on earlier MeerKAT measurements while strengthening the ability to test what remains after processing. The cleaning exploits differences in how foreground emission and the hydrogen signal vary across the observed frequencies.
The same cosmic structures should recur across independent maps, while some instrumental errors and random noise differ. Comparing the subsets helps retain the common sky signal and suppress contributions that do not repeat consistently. The researchers also used simulations and tests to assess how processing could remove genuine
hydrogen emission alongside the foregrounds.
That is where carefully constructed models become important companions to observations. As with cosmic simulations, the goal is to understand which patterns reflect the Universe and which arise from the method used to study it. Here, the analysis accounted for uncertainty in signal lost during cleaning.
Measuring the pattern rather than individual objects
The team measured a power spectrum, a statistical description of how strongly the hydrogen signal varies across different spatial scales. Stronger clustering means matter is distributed less evenly at those scales. The resulting measurement reached a signal-to-noise ratio of 6.2.
This provides a quantitative connection between hydrogen and large-scale structure. The radio glow acts as a tracer of where galaxies and their gas gather. It also gives researchers information about the combination of hydrogen abundance and how strongly hydrogen follows the underlying matter distribution.
Relating such tracers to dark matter requires modeling, because the telescope measures hydrogen emission directly. The importance of this result lies in recovering hydrogen clustering from the survey’s own radio data. It did not require a separate optical galaxy catalog to establish the clustering signal.
The authors nevertheless identify limits. Individual subset power measurements contained excess power associated with unresolved systematic effects, although the cross-subset measurements passed extensive consistency and null tests. Those tests support the detection while leaving further calibration and contamination control important for future precision work.
Preparing for much larger cosmic maps
MeerKLASS principal investigator Mário Santos, at the University of the Western Cape, emphasized the collaboration behind the result. Researchers worked across seven countries and three continents over a decade. The South African Radio Astronomy Observatory built and operates MeerKAT, providing the engineering and support needed for the survey. “Such an ambitious result requires sustained and genuine teamwork from many people,” Santos said.
The next objective is to extend that work across much more space. Since 2023, the collaboration has collected lower-frequency observations, reaching hydrogen from earlier cosmic periods. It ultimately expects to survey a volume more than 1,000 times larger than the volume used for this detection, increasing its potential to investigate dark energy. Many early-career researchers have spent their entire research careers contributing to the project, Santos noted.
Larger maps could track both the growth of structure and cosmic expansion. Together, those measurements could help test models of gravity and the Universe’s accelerating expansion. The current detection establishes a measurement capability rather than a new explanation for either phenomenon.
MeerKAT also serves as a precursor to the SKA Observatory, giving researchers experience relevant to future surveys. For now, the essential advance is extracting a repeated pattern from an exceptionally faint hydrogen glow. Making that measurement reliable is what allows the prospect of a much larger cosmic map to move closer.
Dig deeper into hydrogen intensity mapping
These studies trace the development of intensity mapping and its use in measuring cosmic structure.
- Detection of the Cosmological 21 cm Signal in Autocorrelation at z ∼ 1 with the Canadian Hydrogen Intensity Mapping Experiment: Reports a hydrogen clustering detection from CHIME’s own radio data, providing a complementary demonstration at an earlier cosmic epoch and different spatial scales. (The Astrophysical Journal, October 2026)
- MeerKLASS L-band deep-field intensity maps: entering the H i dominated regime: Presents the deep survey maps and improved analysis pipeline that helped prepare the way for the new clustering measurement. (Monthly Notices of the Royal Astronomical Society, February 2025)
- H i intensity mapping with MeerKAT: power spectrum detection in cross-correlation with WiggleZ galaxies: Detects matching clustering in MeerKAT hydrogen maps and an optical galaxy survey, illustrating the external cross-correlation approach used in earlier work. (Monthly Notices of the Royal Astronomical Society, February 2023)
- H i intensity mapping with MeerKAT: calibration pipeline for multidish autocorrelation observations: Develops the calibration and observing methods needed to turn independently operated radio dishes into a useful cosmological survey instrument. (Monthly Notices of the Royal Astronomical Society, May 2021)
- An intensity map of hydrogen 21-cm emission at redshift z ≈ 0.8: Uses Green Bank Telescope observations and a galaxy-survey comparison to demonstrate an early route to mapping unresolved cosmic hydrogen. (Nature, July 2010)
Research findings are available online in the journal Monthly Notices of the Royal Astronomical Society.
The original story "MeerKAT finds ancient hydrogen clusters, offering a new way to chart the Universe" is published in The Brighter Side of News.
Related Stories
- South Africa’s MeerKAT array detects the first radio signal directly from an exoplanet
- Before MeerKAT, South Africa's Karoo telescope had its own ways of reading the stars
- MeerKAT detects a faint hydrogen signal from billions of years ago
Like these kind of feel good stories? Get The Brighter Side of News' newsletter.
Joseph Shavit
Writer, Editor-At-Large and Publisher
Joseph Shavit, based in Los Angeles, is a seasoned science journalist, editor and co-founder of The Brighter Side of News, where he transforms complex discoveries into clear, engaging stories for general readers. With vast experience at major media companies like The Los Angeles Times, Times Mirror and Tribune Publishing, he writes with both authority and curiosity. His writing focuses on space science, planetary science, quantum mechanics, geology. Known for linking breakthroughs to real-world markets, he highlights how research transitions into products and industries that shape daily life.